MODULE 4 ·
INDICATORS & EDGE

Indicators &
Confluence

This module shows how to use indicators as a support tool, not a crutch. You’ll learn how to stack confluence between structure, levels and indicators, and how to avoid cluttered charts that create confusion instead of clarity. The goal is a clean, simple toolkit that confirms your read on price action.

Lesson 4.1

The Real Role of Indicators

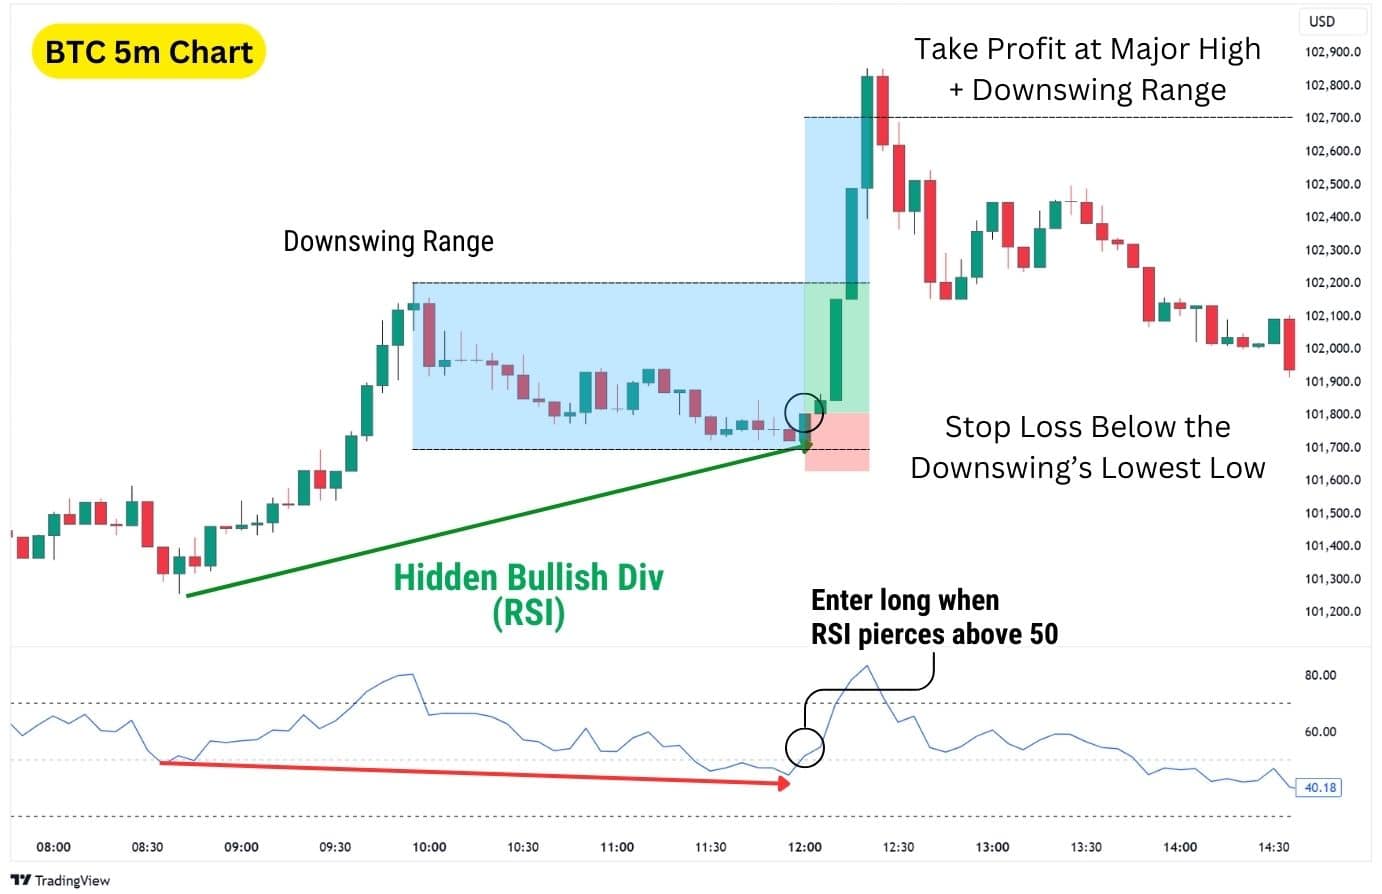
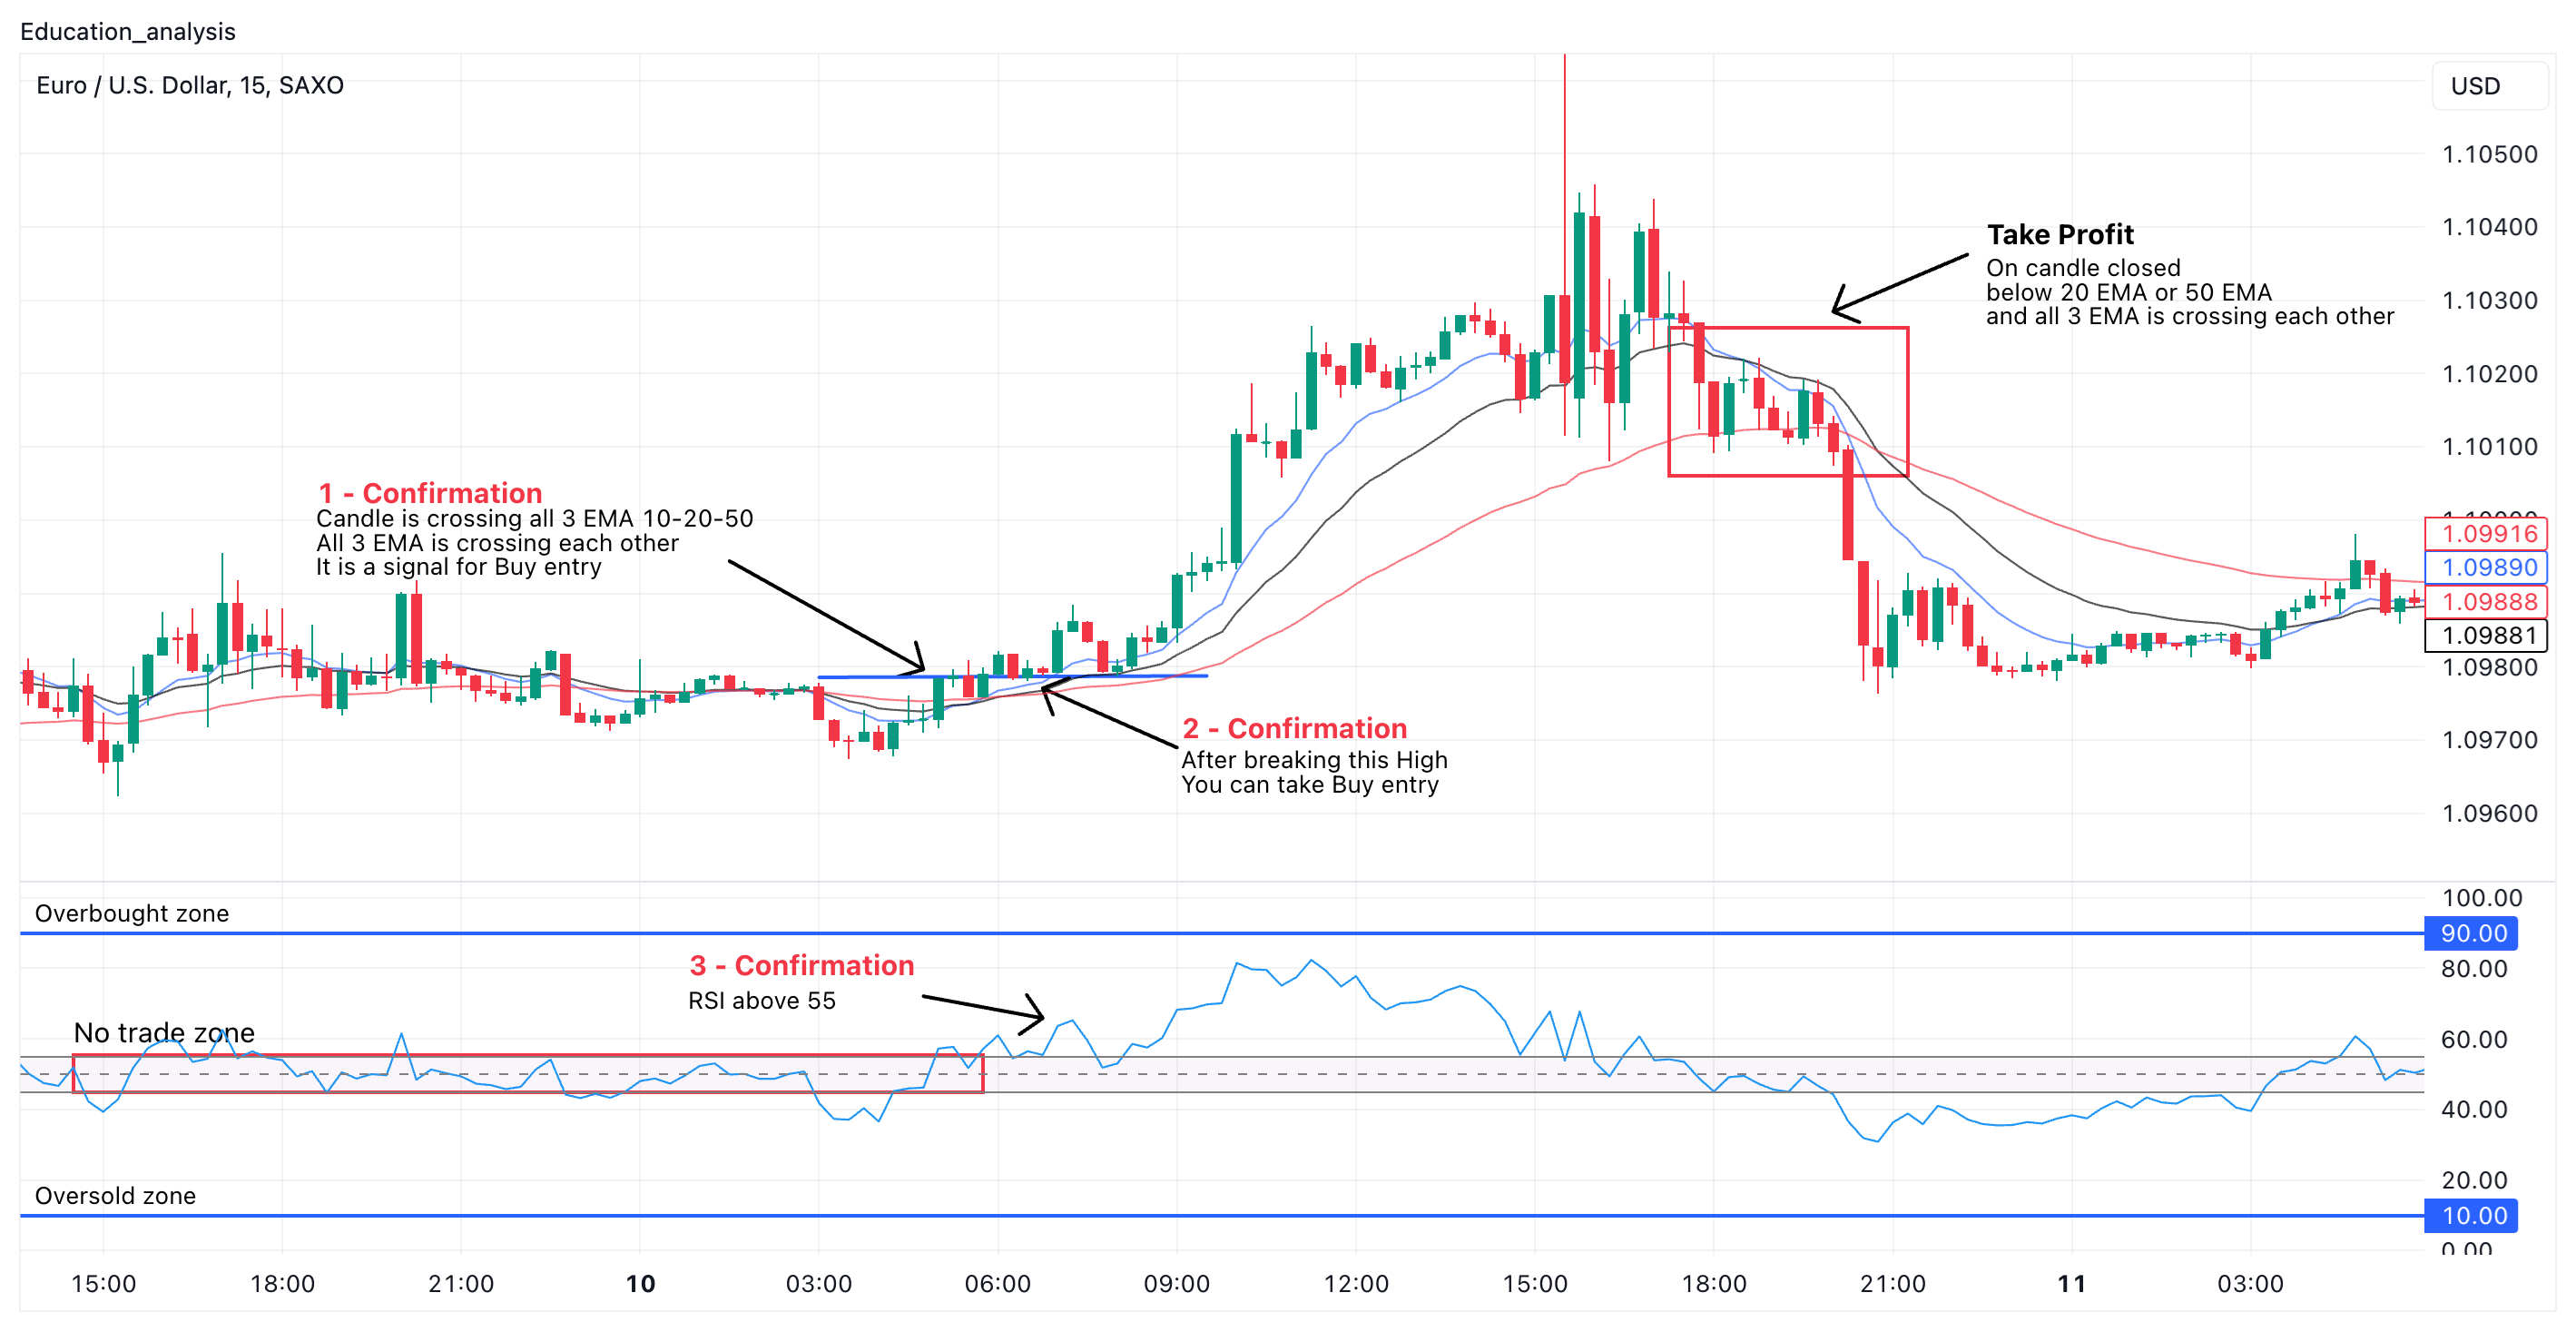
Indicators are summaries of price, not a replacement for price. Their job is to highlight momentum, volatility or trend strength so you can make clearer decisions—not to generate magical buy and sell arrows.

When indicators are used to confirm a bias built from structure and trend, they add confidence. When they are used alone, they usually create late entries and mixed signals.

Lesson 4.2

Building Confluence the Right Way

Confluence means several independent pieces of information pointing in the same direction. For example:

  • Higher timeframe uptrend and bullish structure
  • Price retesting a key support or demand zone
  • Momentum indicator crossing from weak to strong territory

One signal can be wrong. Three aligned signals are harder to ignore. Confluence doesn’t guarantee a win, but it pushes the odds in your favour.

Chart showing structure, indicator confirmation and support level aligning in a confluence zone
Example of confluence: bullish structure, a retest of support, and a momentum indicator confirming strength in the same area.
Lesson 4.3

Trend Tools: Moving Averages & EMAs

Moving averages are simple ways to visualise trend direction. When price holds above a rising EMA in an uptrend, pullbacks into that average often act as dynamic support. When price stays below a falling EMA, it often acts as resistance.

The key is to use one or two meaningful averages, not a full rainbow. Too many lines means you can justify any decision after the fact.

Lesson 4.4

Momentum Tools: RSI & Oscillators

Oscillators like RSI help track when momentum is fading or building. Overbought and oversold levels are less important than how RSI behaves around the midline and previous swing highs or lows in the indicator itself.

Divergences—where price makes a new high but RSI does not—can warn of a weakening move. They work best when aligned with structure breaks, not used in isolation.

Lesson 4.5

Good vs Bad Indicator Use

Bad indicator use means stacking so many tools on the chart that every candle looks like a signal. Good use means having a small, intentional set of tools that each answer a specific question.

A clean chart with one or two well-chosen indicators is usually far more powerful than a messy chart that tries to watch everything at once.

Side-by-side comparison of cluttered indicator-heavy chart versus a clean, focused indicator setup
A clean chart using a minimal set of indicators, RSI (bottom) and EMA (trend lines) to confirm structure and trend.
Lesson 4.6

Designing Your Indicator Toolkit

Your toolkit should be simple and intentional. One tool for trend, one for momentum, and optionally one for volatility is usually enough.

The aim is to build a repeatable checklist: structure and trend first, key levels second, indicators last. When that order is respected, indicators amplify your edge instead of diluting it.