MODULE 5 ·
LIQUIDITY & FLOW

Liquidity &
Smart Money

This module focuses on how liquidity really works in crypto markets. You’ll see how price hunts stop losses, where large players enter and exit, and how to read smart-money behaviour using structure and liquidity maps. Instead of feeling “manipulated”, you learn to anticipate the games.

Lesson 5.1

What Liquidity Actually Is

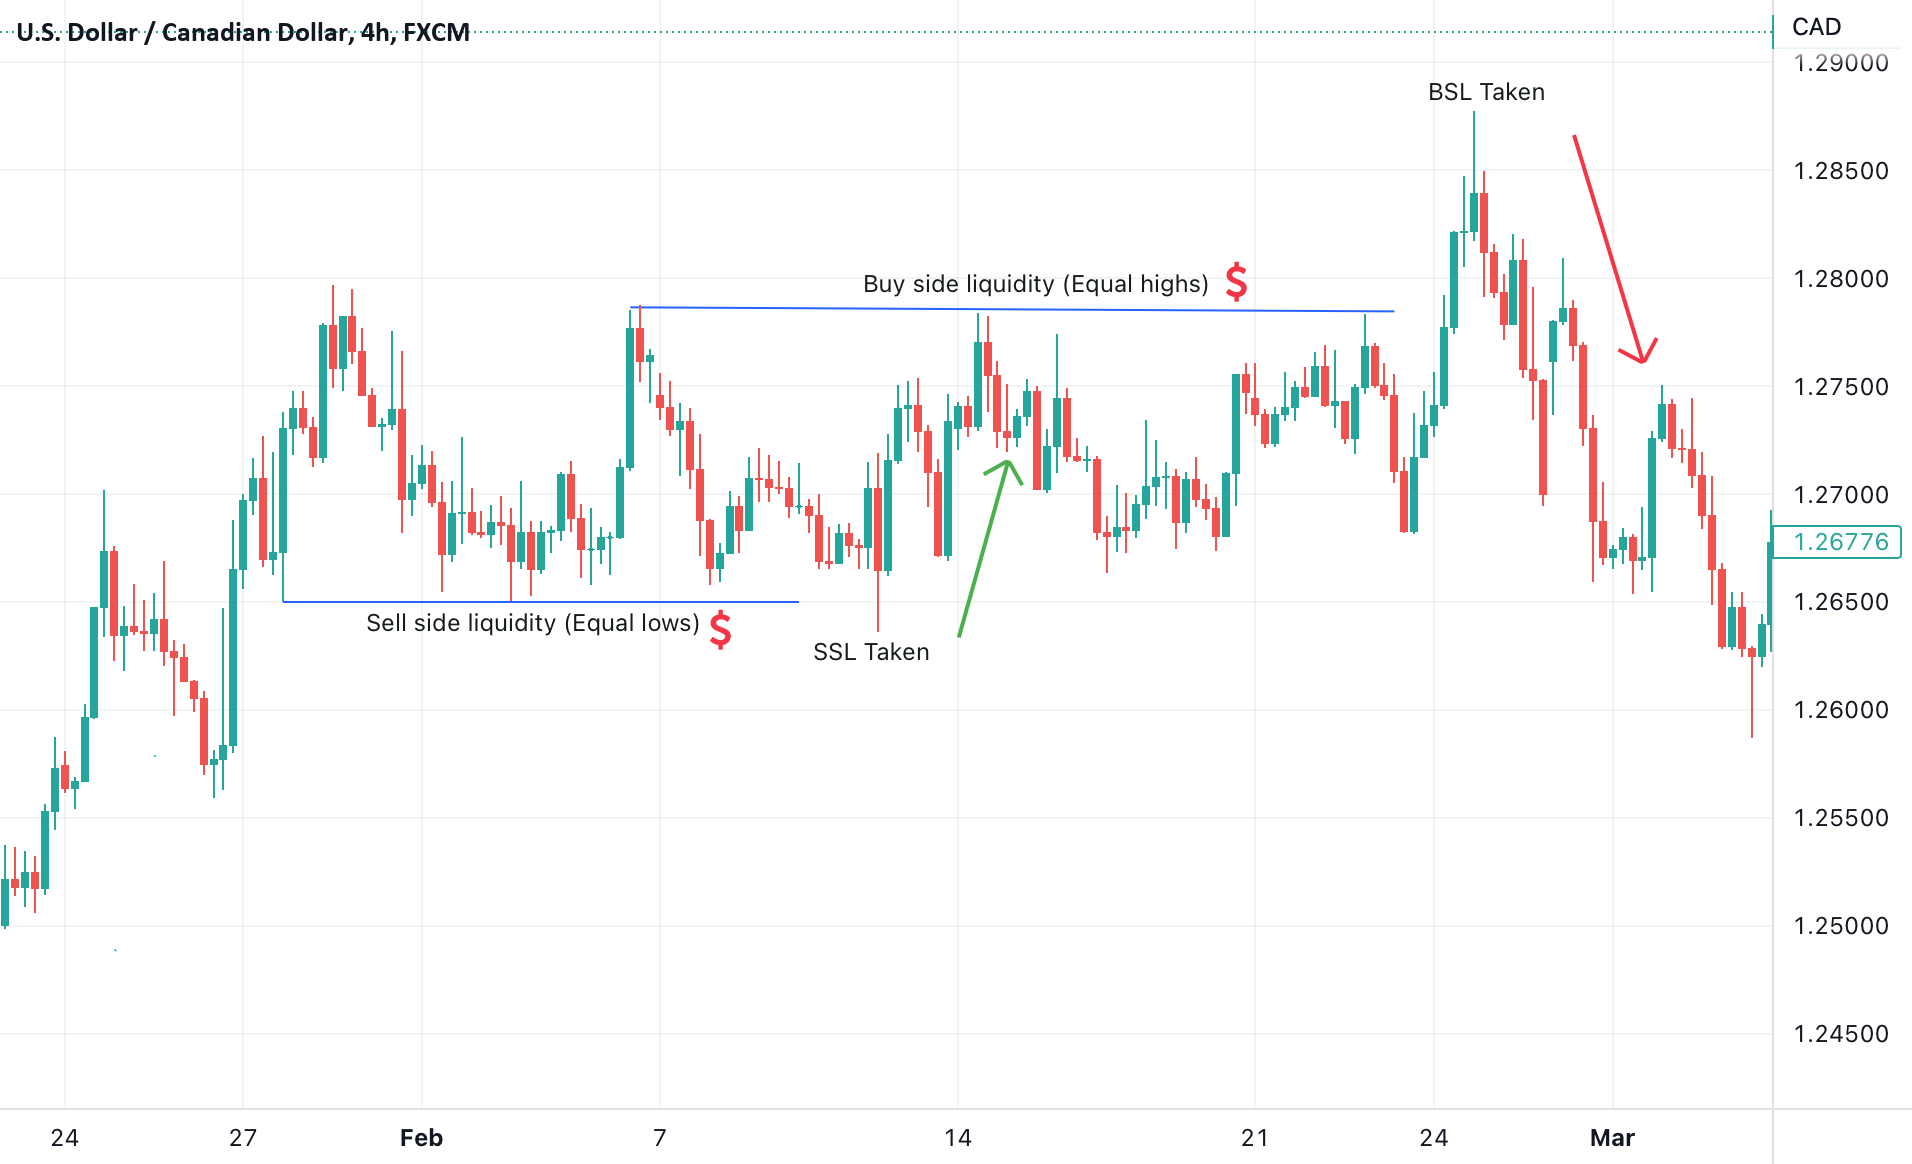
Liquidity is the fuel that allows large orders to be filled. It clusters around obvious highs, lows, and breakout levels where traders place stops and pending orders. When price moves sharply into those areas, it’s often seeking liquidity, not randomly spiking.

Understanding this explains why markets often move to the most obvious stop areas before choosing a real direction.

Lesson 5.2

Liquidity Pools & Stop Hunts

Equal highs, equal lows, and tight clusters of stops form liquidity pools. Price will often trade just beyond these levels, trigger stops, fill larger positions, and then reverse. This is what many traders call a “stop hunt” or “liquidity grab”.

Your aim is to recognise where those pools sit and avoid placing stops directly inside the most obvious zones.

Chart showing buy-side and sell-side liquidity with stop hunts above equal highs and below equal lows
Illustration of buy-side liquidity above equal highs and sell-side liquidity below equal lows. Price wicks through these pools to trigger stops before reversing.
Lesson 5.3

Premium & Discount Zones

In a bullish move, the lower half of a swing range is often considered “discount”, while the upper half is “premium”. Smart money prefers to buy in discount and offload or hedge in premium.

Mapping out these zones on the chart helps avoid buying into stretched moves or shorting into obvious discount levels where buyers are waiting.

Lesson 5.4

Change of Character & Smart Money Shifts

A change of character (CHoCH) marks the first clear sign that control is shifting between buyers and sellers. In a downtrend, this often looks like a strong break of a lower high followed by higher lows starting to form.

When this shift happens near a major liquidity pool or key zone, it often signals smart money stepping in on the other side of the previous trend.

Diagram showing a downtrend turning into an uptrend with a clear change of character and retest
Example of a downtrend transitioning into an uptrend with a change of character (CHoCH), break of structure, and a retest zone where smart money often enters.
Lesson 5.5

Reading Manipulation Without Emotion

What feels like “manipulation” is often just the market seeking the most efficient place to fill large orders. Sudden spikes, fake breakouts, and sharp reversals usually make more sense when seen through a liquidity lens.

By focusing on where stops and trapped traders are likely positioned, you stop taking these moves personally and start anticipating where they might happen.

Lesson 5.6

Using Liquidity in Your Trade Plans

Liquidity becomes another layer of confluence in your plan. Instead of entering in the middle of nowhere, you can target entries after liquidity has just been taken, or avoid placing stops where everyone else is clustered.

Combined with structure, trend, and risk management, this helps you trade with the flow of larger players instead of being positioned against them.